Typometer
Typometer is a tool to measure and analyze visual latency of text / code editors.
Editor latency is delay between an input event and a corresponding screen update, in particular case – delay between keystroke and character appearance. While there are many kinds of delays (caret movement, line editing, etc.), typing latency is a major predictor of editor usability.
Check my article Typing with pleasure to learn more about editor latency and its effects on typing performance.
Project source code is available as a GitHub repository.
Download: typometer-1.0.1-bin.zip (0.5 MB)
Java 8 or latter is required to run the program. You can download Java from the official site.
Features
- Cross-platform (Windows, Mac, Linux).
- Native API calls for faster screen access.
- Synchronous / asynchronous modes.
- Import / export of CSV data.
- Summary statistics, frequency distribution.
- Line / bar charts (including comparative ones).
- Chart image export (with legend).
Screenshots
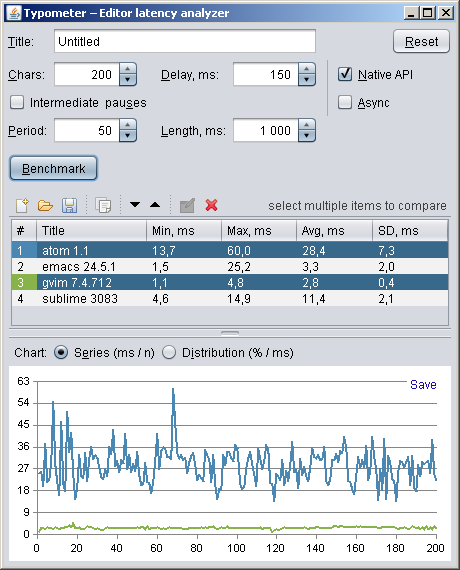
Main window:

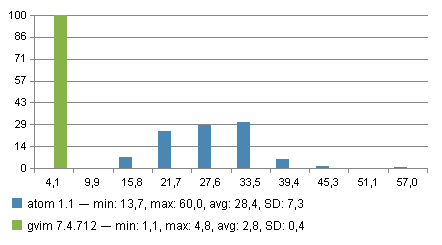
Frequency distribution chart:

Principle
The program generates OS input events (key presses) and uses screen capture to fully automate the test process.
At first, a predefined pattern (“.....“) is inserted in editor window in order to detect screen metrics (start position, step, background, etc.).
After that, the program types a predefined number of “.” characters into the editor (with given periodicity), measuring delays between key presses and corresponding character drawings.
To achieve high accuracy of measurement, only a single pixel is queried for each symbol. Moreover, the program can use fast native API (WinAPI, XLib) calls on supported platforms, offering AWT robot as a fallback option.
There are two modes of testing available:
- Synchronous – the program always waits for typed character to appear before making a pause and typing the next character. It’s the most accurate method (because there’s no threading overhead).
- Asynchronous – the program types and recognizes characters independently. This method is slightly less accurate, but it’s useful for testing rapid typing, when editor drawing might easily lag by multiple characters.
Usage
To register only essential editor latency, text must be rendered directly to framebuffer, without intermediate image processing that might introduce additional delay. Prefer stacking window managers to compositing window managers for the testing purposes, particularly:
- Switch to Classic theme in Windows. Windows Aero enforces internal vertical synchronization, which leads to minimum 1 frame lag (about 17 ms for 60 Hz monitor refresh rate) and delay discretization. It’s also possible to disable the compositing directly in Windows 7 and in Windows 8.
- Use Linux distributive with lightweight window manager, like Lubuntu (Openbox). Complex, 3D-based windows managers might substantially increase system rendering latency, for example, on my hardware, Ubuntu’s Compiz, adds ~10 ms unavoidable lag.
Close all programs that add system-wide keyboard hooks, as they might process the keyboard events synchronously and affect the results (for example, Workrave is known to noticeable increase the typing latency).
You may consider switching your machine in a particular hardware mode (power scheme, integrated / discrete graphics, etc.). In power save mode (and on battery), for example, editor responsiveness is usually much lower, so it’s possible to detect significant performance glitches which are less frequently observable otherwise.
Before you start benchmarking, make sure that other applications are not placing noticeable load on your system. It’s up to you whether to “warm up” VM-based editors, so they can pre-compile performance-critical parts of their code before proceeding.
If possible, enable non-block caret (i. e. underline / vertical bar instead of rectangle) in editor. This might increase measurement accuracy.
Typical action sequence is the following:
- Specify a measurement title, like “HTML in Vim” (optional, can be set later).
- Configure test parameters (optional).
- Launch an editor, maximize its window.
- Open some data in the editor, for instance, a large HTML file (optional).
- Place editor caret in desired context (like comment, etc.), at the end of short / empty line.
- Start benchmarking process in the program.
- After a corresponding prompt, transfer focus to the editor window.
- Wait for test completion, don’t interfere with the process.
You can always interrupt the testing process simply by transferring focus back to the program window.
After test result is acquired, you may either analyze the singular data by itself or perform additional tests (different editors / conditions) to do comparative analysis.
Both source- and aggregate data is easily accessible, you can:
- copy table content as text,
- save chart to PNG file (with legend and summary stats),
- export raw data in CSV format (for Calc or R, if you fancy).
It’s possible to merge results either by inserting data from an existing CSV file, or by appending data to a CSV file on saving.
Recipes
Here are a few tips on how you can use the tool to detect performance bottlenecks in text / code editors:
- Check whether number of lines influences the latency. If so, typing might “lag” inside a large file.
- Check whether editor window size influences the latency. If so, the editor probably does excessive repainting instead of drawing only a newly inserted symbol.
- Check whether latency depends on horizontal symbol position. Ideally, that correlation should be undetectable.
- Try to enable highlighting / autocomplete / folding / spellchecker / etc. Those features should be processed asynchronously, without affecting the typing as such.
- Try to run the test in power-saving mode. Ideally, typing should be handled decently even on less powerful hardware.
If you’re implementing a text / code editor, take a look at the programming techniques to significantly reduce the drawing latency.
Troubleshooting
To make benchmarking possible, correct screen metrics must be detected at the initial step. The program attempts to recognize a custom pattern (5 new dots) in order to determine the following parameters:
- starting position,
- horizontal step,
- background color,
- line length,
- caret type.
Because there are many editors (and multiple versions of each editor), which looks different on different platforms, and there are many possible color schemes and fonts, the metrics recognition algorithm has to be very flexible. While the program sources contain a great deal of test cases, some glitches are still probable.
Here’s a list of typical problems and corresponding solutions:
- Editor background is non-uniform (gradient, picture) – set solid color background.
- Characters are too low-contrast and obscure – use a crisp color scheme.
- Dot characters merge with the caret – increase font size.
- Editor replaces multiple dots with ellipsis – disable that auto-correction.
- Spaces between dots are uneven – use monospaced font in the editor.
- Editor has a left panel that melds with the text area – hide the panel.
Feel free to contribute by creating additional test case images (check /src/test/resources directory for examples).
See also:
- Typing with pleasure — Human- and machine aspects of typing latency, experimental data on latency of popular text / code editors.
- Low-latency painting in AWT and Swing — In-depth analysis of delay sources in AWT / Swing architectures, methods to significantly reduce the drawing latency.


[…] the sources of visual latency and improve your users’ experience. Pavel also published a benchmarking tool to help analyze end-to-end visual latency for text editors. Further data and analysis is available […]
[…] measurement was performed using the amazing tool, Typometer, that captures the delay between key press action and its appearance on the screen. As you see the […]
[…] Typometer: A tool to measure and analyze the visual latency of text editors (pavelfatin.com) […]